Often, the value of the last data point in price series data is important to the viewer. Adding these yourself is always clumsy.

I considered creating my own geom to handle these but decided to see if someone else did the work for me. The answer, kind of. The directlabels is intended to replace the legend and add labeling directly in the plot area.
library(dplyr)
library(ggplot2)
library(directlabels)
tx <- time(mdeaths)
Time <- ISOdate(floor(tx),round(tx%%1 * 12)+1,1,0,0,0)
uk.lung <- rbind(data.frame(Time,sex="male",deaths=as.integer(mdeaths)),
                 data.frame(Time,sex="female",deaths=as.integer(fdeaths)))

ggplot(uk.lung, aes(x=Time, y=deaths)) +
  geom_line(aes(color=sex)) +
  geom_dl(aes(label=sex, color=sex)
                    , method = list("last.points"))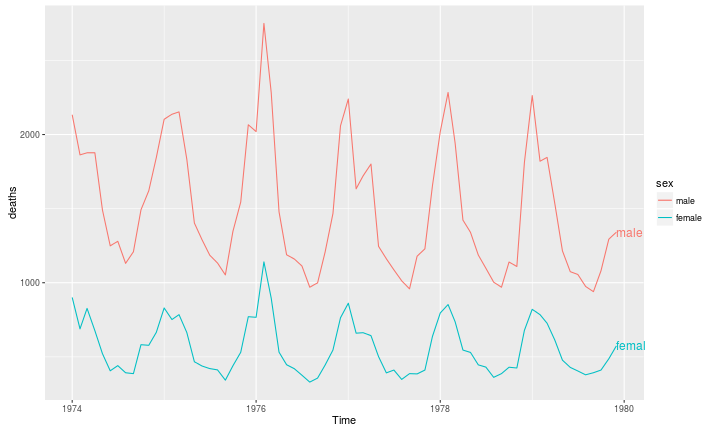
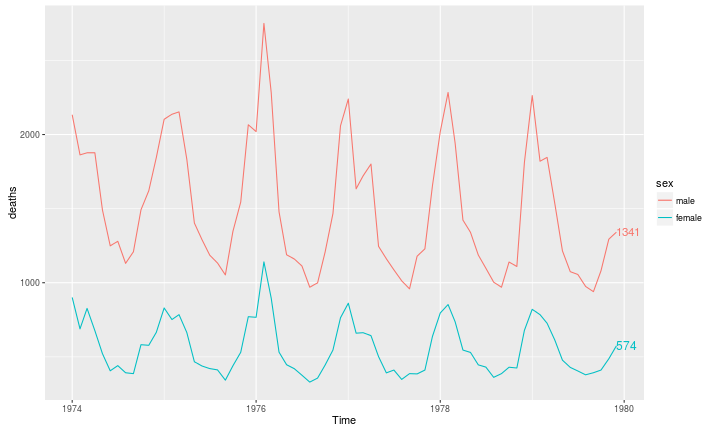
The geom_dl is a custom geom in the directlabels package and is easy to use. This is a nice feature and has lots of options, but I am looking for a way to show that the last data point for male is 1341 and female is 574. The package is not designed to do this, but with a small data hack, we can still use it.
tx <- time(mdeaths)
Time <- ISOdate(floor(tx),round(tx%%1 * 12)+1,1,0,0,0)
uk.lung <- rbind(data.frame(Time,sex="male",deaths=as.integer(mdeaths)),
                 data.frame(Time,sex="female",deaths=as.integer(fdeaths))) %>%
  group_by(sex) %>%
  mutate(last_value = last(deaths))

ggplot(uk.lung, aes(x=Time, y=deaths)) +
  geom_line(aes(color=sex)) +
  geom_dl(aes(label=last_value, color=sex)
                        , method = list("last.qp"))