Just for fun, I took my avatar image and plotted the png data into a scatterplot.
![]()
It was relatively easy to do using the png package.
library(dplyr)
library(tidyr)
library(ggplot2)
library(ggthemes)
library(png)

# Read the png into a matrix. The png has three layers (see third dimension)
#  but I only care about one.
av = readPNG("../img/avatar-icon2.png")[,,1]
num_rows = NROW(av)
num_cols = NCOL(av)

# Add a column of row numbers
av = cbind(1:num_rows, av)

# Gather the matrix into three columns for easy plotting
df.av = av %>% as.data.frame() %>% gather("rows", "cols", 2:(num_cols+1))

# Clean up the data to make sure X and Y are integers
df.av$rows = as.integer(gsub("V", "", df.av$rows))
colnames(df.av) = c("Y", "X", "COL")
df.av$COL = round(df.av$COL, 3)

# For fun, calculate R^2 on the dark points of the data
lm_sum = df.av %>% filter(COL < .1) %$% lm(Y ~ X) %>% summary()

eq = substitute(~italic(r)^2~"="~r2, list(r2 = format(lm_sum$r.squared, digits = 3)))
eq_lab = as.character(as.expression(eq))

# Plot the data.frame
#  I reversed the y scale to get the image upright.
ggplot(df.av) +
  geom_point(aes(x=X, y=Y, color=COL)) +
  annotate("text", label=eq_lab, x = num_cols*.9, y = 10, color="white", parse=T, size=5.5)+
  scale_y_reverse() +
  labs(title="", x="x", y="y", color="Col") +
  theme_classic()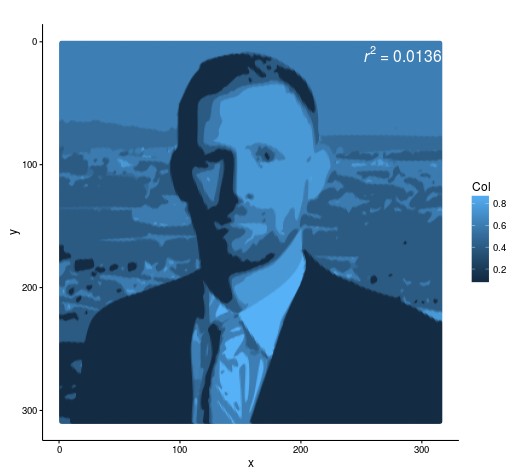
Wasn’t that fun!